
Scenario
Production is throwing errors. You know they're happening - maybe from a monitoring alert, maybe from an angry email - but you can't reproduce them locally. The call stack is buried in a nested procedure chain and nobody knows which one is failing.
This is my go-to technique for these situations. An Extended Events session that captures errors with their full calling stack, plus a script to parse that stack into something readable.
The problem
Like in a real-world scenario, I'll start with the problem first.
I will create a procedure SharedLogic that either passes or fails based on the parameter.
Then I will simulate nesting by creating two more procedures Caller1 and Caller2 that are wrappers around this procedure.
CREATE OR ALTER PROCEDURE dbo.SharedLogic (@trueFalse bit)
AS
IF (@trueFalse = 1) /* golden path - no error */
    SELECT 1 as Pass
ELSE
    SELECT 1/0 as Error /* Generate a divide by 0 error */
GO

CREATE OR ALTER PROCEDURE dbo.Caller1(@passThrough bit) /* Simulate nesting 1 */
AS
EXEC dbo.SharedLogic @trueFalse = @passThrough
GO

CREATE OR ALTER PROCEDURE dbo.Caller2 (@passThrough bit) /* Simulate nesting  2*/
AS
EXEC dbo.SharedLogic @trueFalse = @passThrough
GO
Once the procedures are created, we can test the errors by calling all combinations of parameters.
GO
EXEC dbo.SharedLogic @trueFalse = 0 /* Error */
GO
EXEC dbo.SharedLogic @trueFalse = 1
GO
EXEC dbo.Caller1 @passThrough = 0 /* Error */
GO
EXEC dbo.Caller1 @passThrough = 1
GO
EXEC dbo.Caller2 @passThrough = 0 /* Error */
GO
EXEC dbo.Caller2 @passThrough = 1
GO
GO to capture a single statement at a time.
Capturing the errors
To capture the errors, we'll use an Extended Events session. Here's a basic example.
CREATE EVENT SESSION [Error_reported] ON SERVER
ADD EVENT sqlserver.error_reported
(
    ACTION
    (
          sqlserver.server_instance_name   /* good practice for multi server querying */
        , sqlserver.client_app_name        /* helps locate the calling app */
        , sqlserver.client_hostname        /* calling computer name */
        , sqlserver.server_principal_name  /* can be switched to a user */
        , sqlserver.database_id            /* can be switched to a database_name */
        , sqlserver.sql_text               /* grab calling parameters from input buffer */
        , sqlserver.tsql_stack             /* get the whole stack for parsing later */
    )
    WHERE
    (
        severity > 10
        /* Please test and provide additional filters! */
    )
)
ADD TARGET
    package0.event_file
    (
        SET
            filename=N'Error_reported'
            , max_file_size= 20 /* MB */
)ALTER ANY EVENT SESSION permission (or CONTROL SERVER).
Analysing the errors
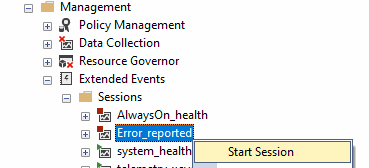
Let's start the Extended Events session. You can do this with TSQL or through the GUI in Object Explorer.
ALTER EVENT SESSION Error_reported ON SERVER STATE = Start /* Stop */
Don't forget that Extended Events sessions are instance-level objects - that means you are monitoring all databases. If you only want to monitor a specific database, add it to the filters.
In our local environment, we can right-click the session and select XE Watch Live Data
Once you have an XE session running, you can stream its events live in SSMS without needing a file target. Right-click the session in Object Explorer and choose Watch Live Data. Caveats: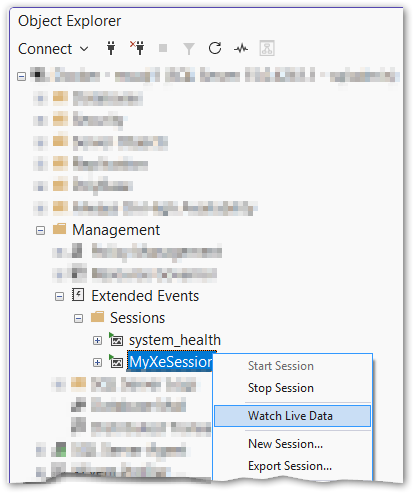
Let's rerun the EXEC statements to generate the errors once more.
We can see that three events popped up. Let's use the Extended Events menu option Choose columns… to pick the columns of interest.
I have only chosen a few so they can fit on a screenshot.
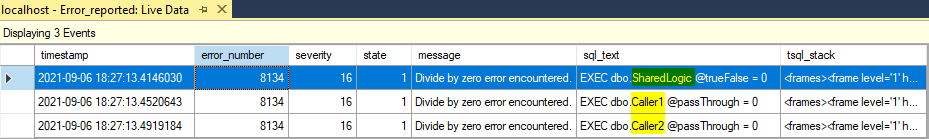
- The XE actions columns (
instance,database,app_name,host_nameandlogin) help with locating the calling process. sql_textprovides us with an example of how to repro the problem along with the parameter values.- And
tsql_stackis my favourite. We can query the plan cache and parse the path through the code using the Parse TSQL StackParse TSQL Stack.Parse the
tsql_stackXML from an Extended Events session into a readable call stack. Paste the<frames>element from the XE event data into the@stackOrFramevariable.The
COALESCEhandles both the old (handle/offsetStart/offsetEnd) and new (sqlhandle/stmtstart/stmtend) XE frame attribute names./* Paste the <frames></frames> here */ DECLARE @stackOrFrame xml = '' ;WITH xmlShred AS ( SELECT COALESCE ( CONVERT(varbinary(64), f.n.value('.[1]/@handle', 'varchar(max)'), 1), CONVERT(varbinary(64), f.n.value('.[1]/@sqlhandle', 'varchar(max)'), 1) ) AS handle, COALESCE ( f.n.value('.[1]/@offsetStart', 'int'), f.n.value('.[1]/@stmtstart', 'int') ) AS offsetStart, COALESCE ( f.n.value('.[1]/@offsetEnd', 'int'), f.n.value('.[1]/@stmtend', 'int') ) AS offsetEnd, f.n.value('.[1]/@line', 'int') AS line, f.n.value('.[1]/@level', 'tinyint') AS stackLevel FROM @stackOrFrame.nodes('//frame') AS f(n) ) SELECT xs.stackLevel, ca.outerText, ca2.statementText FROM xmlShred AS xs CROSS APPLY sys.dm_exec_sql_text(xs.handle) AS dest CROSS APPLY (SELECT LTRIM(RTRIM(dest.text)) FOR XML PATH(''), TYPE) AS ca(outerText) CROSS APPLY ( SELECT SUBSTRING ( dest.text, (xs.offsetStart / 2) + 1, (( CASE WHEN xs.offsetEnd = -1 THEN DATALENGTH(dest.text) ELSE xs.offsetEnd END - xs.offsetStart ) / 2) + 1 ) FOR XML PATH(''), TYPE ) AS ca2(statementText) ORDER BY xs.stackLevel OPTION (RECOMPILE);I have
CASTthe text to XML so it's formatted nicely, but if your code contains XML-specific special characters, it might break.Warning The stack parsing relies onsys.dm_exec_sql_text, which reads from the plan cache. If the plan has been evicted (server restart, memory pressure,DBCC FREEPROCCACHE), the query returns NULL. Run it while the plans are still cached.
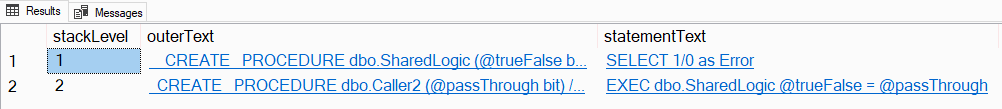
Just paste the stack XML into the @stackOrFrame variable, and we should get the following output.
Conclusion
Set up the session, let it run, and check back when errors happen. The stack parsing query is the real payoff - instead of guessing which procedure in a 6-level deep chain is the culprit, you get the exact path.
Start with the basic session from this post and adapt the filters to your environment. The most common mistake is not filtering enough - without additional predicates, you'll drown in noise from benign errors that fire constantly.
Thank you for reading